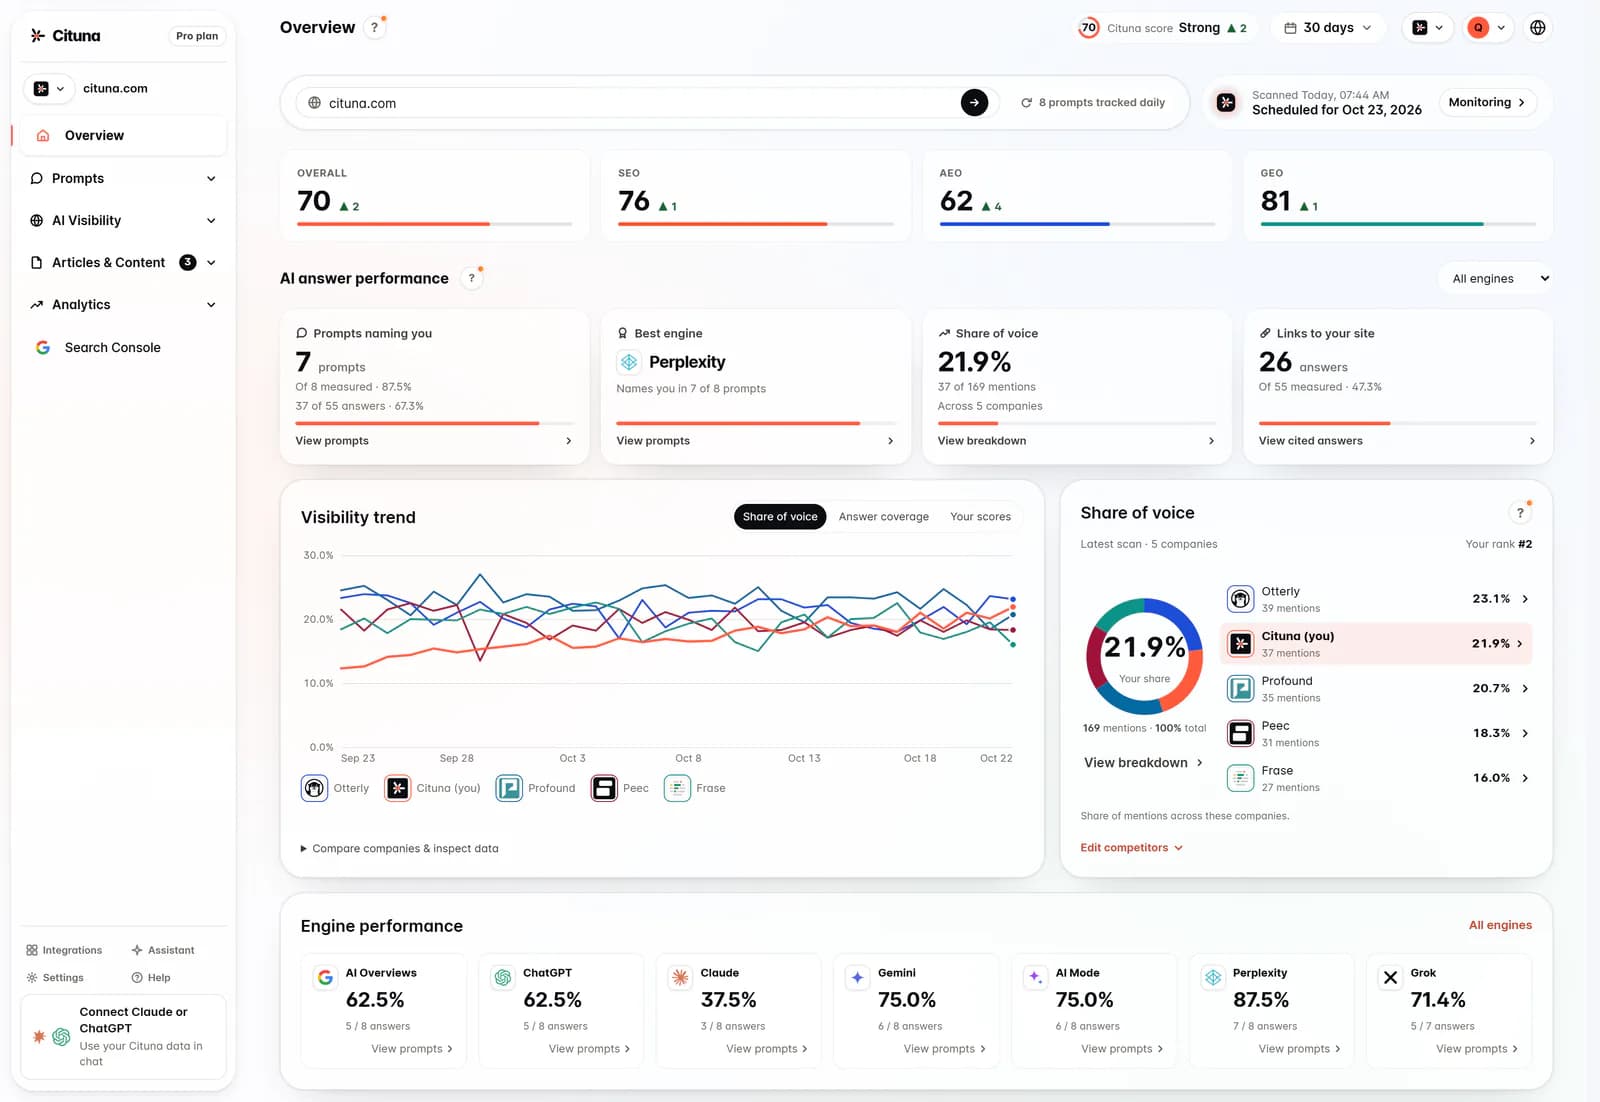
AI share of voice is the percentage of AI-generated answers in your category that mention or cite your brand, measured against the competitors named alongside you. Where classic share of voice counts ad impressions or search rankings, AI share of voice counts how often engines like ChatGPT, Perplexity and Gemini put you in the answer itself, and how prominently. Cituna measures it for you: it runs the same buyer prompts on seven AI engines every day and reports your share of answers against the rivals you track, so the number comes from hundreds of real answers rather than one screenshot.
This guide defines the metric, shows how it differs from the share of voice marketers already know, walks through the measurement method, and works a full example on a hypothetical ten-prompt set.
If you need the number once, the method below works by hand with a spreadsheet: ten to fifty prompts, every engine, a tally of names. If you report it to a team each month, pair a daily tracker with your existing dashboard; Cituna’s Looker Studio connector and its Google Search Console link were built for that hand-off.
What is AI share of voice?
Share of voice has always measured how much of a conversation belongs to you. AI share of voice narrows that to one specific conversation: the answers AI engines generate when someone asks a buying question in your category. Every time ChatGPT, Perplexity, Gemini, Claude, Grok, Google AI Overviews or Google AI Mode composes a response and names a handful of brands, there is a finite amount of attention on offer. Your share of voice is the slice of those mentions that goes to you. You will see the metric written both ways, AI share of voice and share of AI voice; the word order changes, the measurement does not.
It has two moving parts. The first is presence: does the answer name you at all? The second is relative prominence: of the brands it does name, how big is your slice versus each competitor? A brand can score reasonably on presence and still lose on share of voice if every answer that mentions it also mentions three louder rivals. That comparison against a named competitive set is what makes share of voice more useful than a raw count of your own mentions, it is a metric of competitive position, not just activity. It is also the sharpest single number inside the broader discipline of AI visibility, which is the parent metric this sits under.
AI share of voice vs classic share of voice
The word is the same; the surface is not. Classic share of voice, whether the advertising version (your spend or impressions as a fraction of the category) or the SEO version (your ranked positions and clicks for a keyword set), assumes a shared, visible shelf. On a search results page, ten links appear and you compete for a higher slot; in an ad auction, everyone who pays shows up somewhere. Being present is close to guaranteed; the game is position.
An AI answer inverts that. Instead of a ranked list where everyone appears, you get a single synthesized paragraph that names maybe one to five brands, and often names none in your category, or none you would want. The shelf is far shorter, so absence is the default state, not the exception. Two further differences matter for measurement:
- There is no fixed list to rank within. The model composes a fresh answer each time, so you cannot read your position off a stable SERP, you have to sample answers and count.
- Answers vary run to run. Ask the same question twice and the brands named can change. A single check is a snapshot with real noise in it, which is why cadence matters more than it does in classic SOV.
| Dimension | Classic share of voice | AI share of voice |
|---|---|---|
| The surface | A shared list: SERP slots or ad impressions | A single synthesized answer naming a few brands |
| Default state | You appear somewhere; you compete on position | You are absent unless the answer names you |
| What you count | Impressions, rankings or clicks | Mentions and citations across answers |
| Stability | Relatively stable between checks | Varies run to run; needs repeated sampling |
| Unit of comparison | A keyword or a category budget | A prompt set × the engines your buyers use |
Both metrics answer 'what share of the conversation is mine?', but the AI conversation is scarcer, less stable and more winner-take-most, so the same 20% means something very different on each.
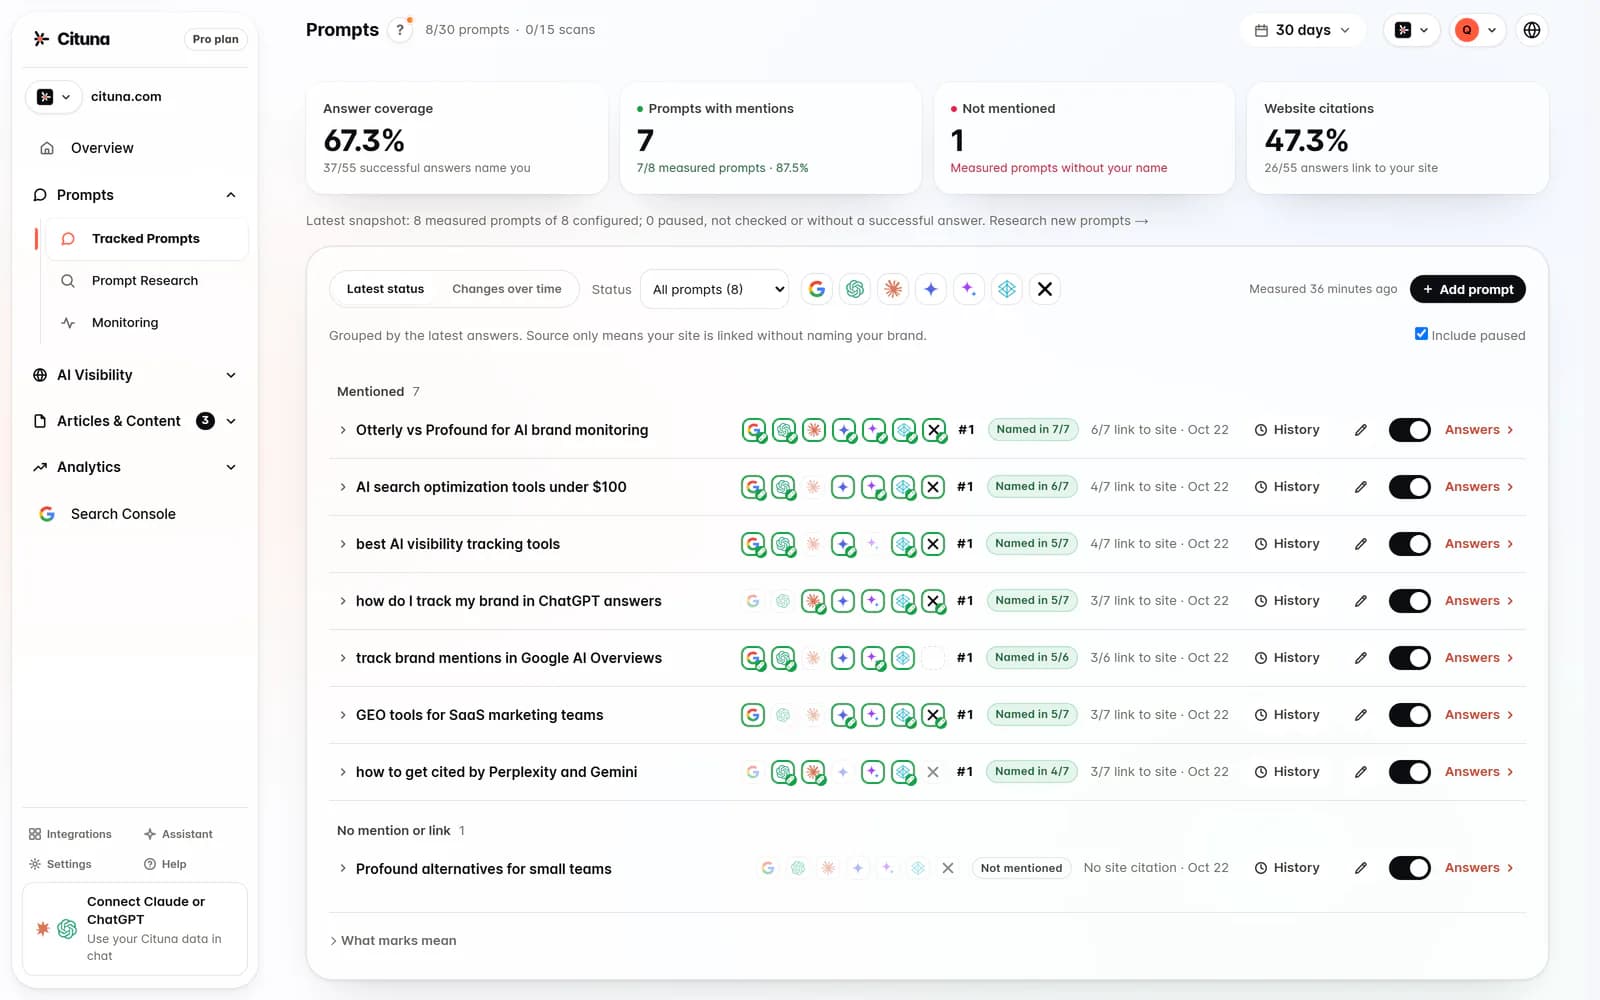
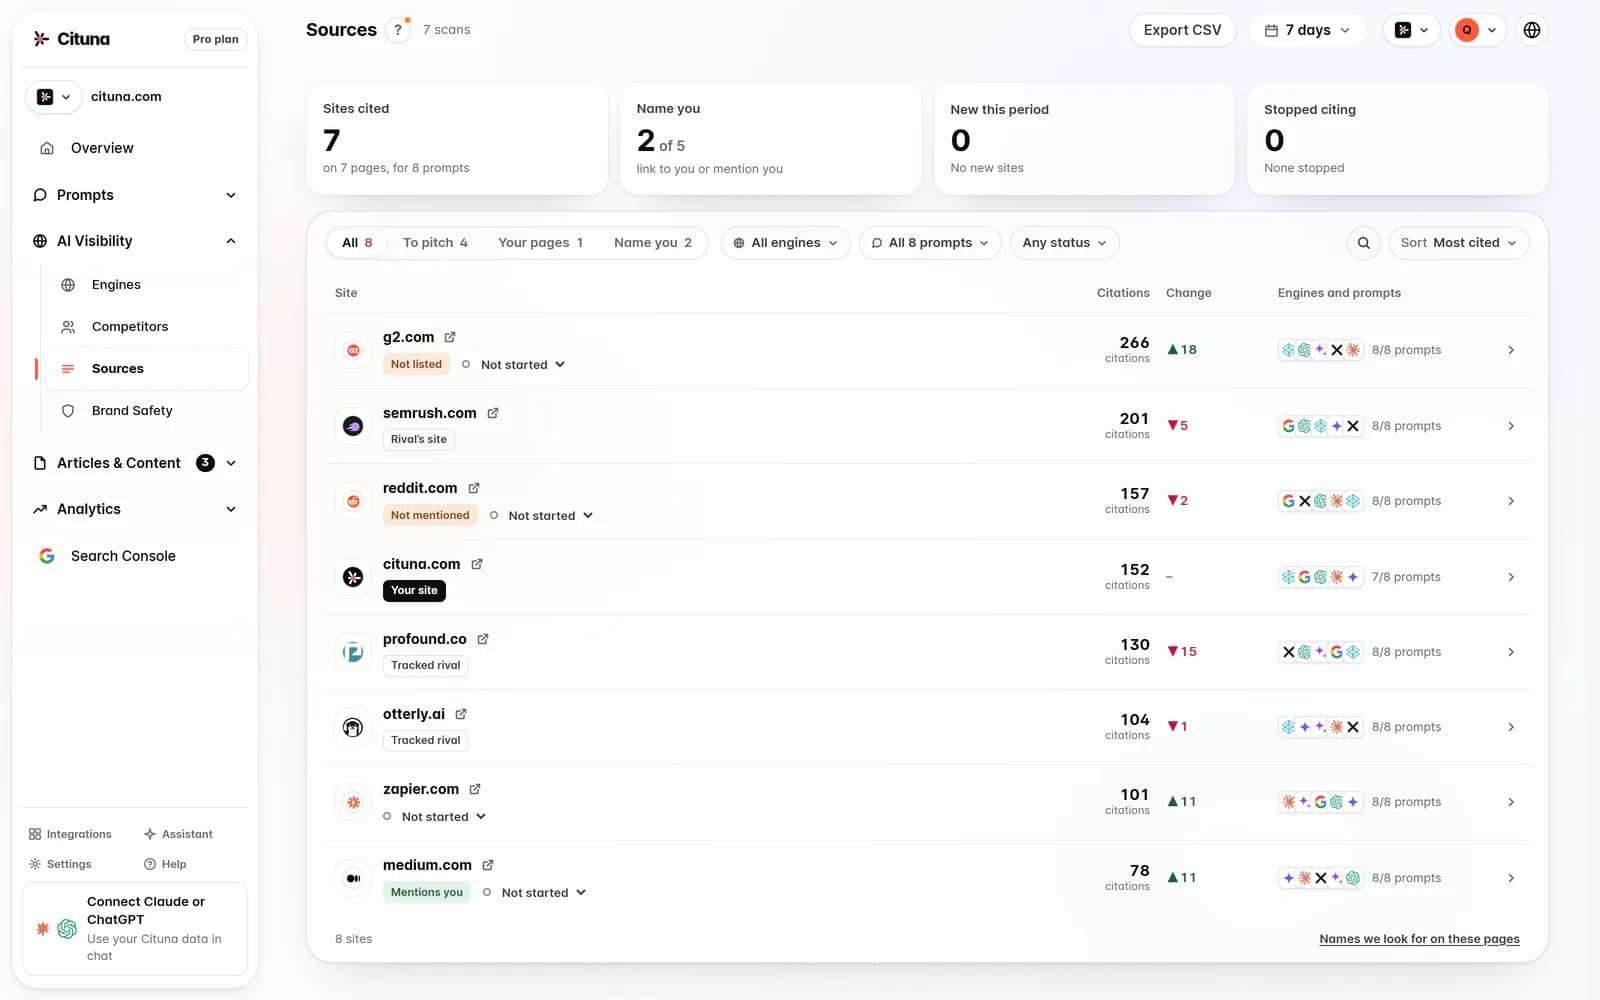
One more distinction is worth naming because it changes how you count: a mention (the model names your brand in its prose) is not the same as a citation (the model links or attributes a source, often your page). Perplexity and Google AI Overviews tend to show explicit citations; a model answering from memory may mention you with no link at all. Both count toward share of voice, but they mean different things, the AI visibility glossary pins down these terms if you want the precise definitions.
How to measure AI share of voice
The measurement reduces to three inputs and three numbers. The inputs are your prompt set, the engines you run it through, and the cadence you run it on. The numbers are your citation rate, your share of voice, and that share weighted by position.
1. Build a representative prompt set
Write the questions your buyers actually ask, ten to fifty is a workable range for most brands, spanning category questions (“best CRM for a small agency”), problem questions (“how do I stop churn”) and comparison questions (“X vs Y”). This set is your definition of “your category,” so keep it fixed once you settle it; changing the questions every month makes the trend meaningless. Add prompts deliberately, and note when you do.
2. Run it across the engines your buyers use
Presence on one engine tells you little about another, so run every prompt through each engine and score them separately before you aggregate. The set worth covering today is ChatGPT, Perplexity, Gemini, Claude, Grok, Google AI Overviews and Google AI Mode, the seven Cituna checks daily. For each answer, record which brands are named and where each falls in the response.
3. Run it on a schedule
Because answers drift run to run, a one-off scan cannot tell you whether a change is a real move or just variance. Run the set on a regular cadence, daily if your category moves fast, at least weekly if it is slower, and read the trend, not any single day. The point of measurement is the direction over time and the specific gaps, not a one-off score.
How much noise to expect: in Cituna’s scans of 25 buyer prompts on seven engines between October 18 and 23, 2026, the same prompt asked again a few hours later named exactly the same tools only 18% of the time, and about a third of the tools in an answer were gone from the next day’s answer. A share of voice read from a single pass is one draw from that spread. Compare averages over several scans rather than two single runs, count each brand once per answer, and keep the engines and the prompt set fixed between the periods you compare.
4. Compute the three numbers, weighting the last by position
Keep citation rate and share of voice distinct. Citation rate is the share of answers that name you, your baseline presence. Share of voice is your slice of all the brand mentions in those answers, your standing versus rivals. They use different denominators and can diverge sharply.
Split presence once more. An answer that names you in its text is a recommendation; one that only lists your page among its sources used you as evidence for someone else. In our own scan of cituna.com on September 27, 2026, 8 of the 11 answers that cited the site used a page as a source without naming Cituna. Count the named answers separately, because the text is what a buyer reads. Cituna marks these answers “Used as a source, not recommended” so the two never blur into one number.
Then, if you can, weight by position. A brand named first, or cited at the top of the source list, earns more attention than one mentioned in passing at the end. Applying a simple weight (first mention worth more than the fourth) turns a flat mention count into a truer picture of prominence, and often reveals that a rival dominates a category far more than a raw count suggests.
5. The formulas, written out
Every number in this guide comes from one of four divisions: the three numbers to report, plus share of answers, which is citation rate worked out for each rival as well. Work them out per engine first, then add the counts across engines and divide once; averaging seven engine percentages gives a thin engine the same weight as a busy one.
| Number | Formula | What it answers |
|---|---|---|
| Citation rate | Answers that name you ÷ answers returned | Are you in the room? |
| Share of answers | Answers that name a brand ÷ answers returned: citation rate, worked out for you and for each rival on the same answers | How often is each brand in the room, side by side? |
| Simple share of voice | Your mentions ÷ all brand mentions in those answers | How big is your slice of the conversation? |
| Position-weighted share of voice | Your weighted mentions ÷ all weighted mentions | How much of the attention is yours? |
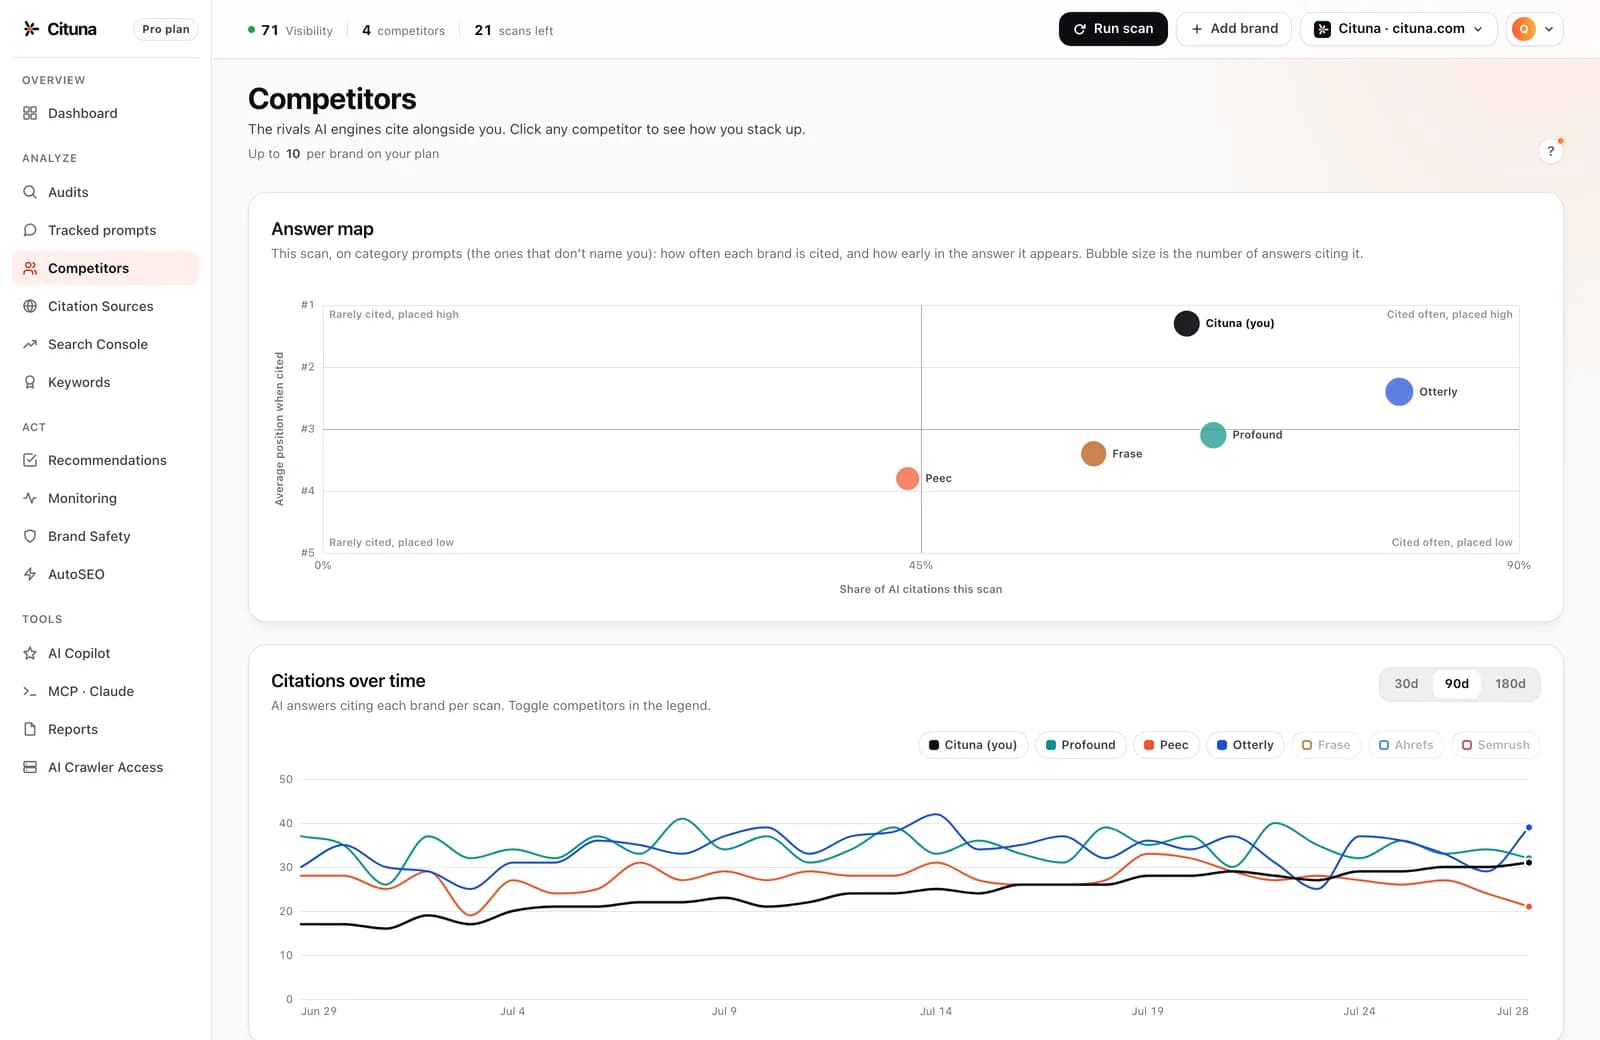
Two rules keep the formulas honest. First, the denominator is answers the engine actually returned: a run that errored measured nothing and leaves the count. Second, leave out prompts that name your own brand (“is Tessera good for agencies?”), because an answer to a question about you names you by default and inflates every number above. Cituna’s Competitors tab applies both rules: its Share column is the share of your tracked category prompts that name each brand, you included, measured on the same answers for everyone, with errored runs and prompts that name your own brand left out.
For the wider set of numbers these sit beside, see the guide to AI visibility metrics; for choosing the prompts that make up the denominator, see how to choose AI visibility tracking prompts.
Tools that measure AI share of voice
To measure AI share of voice daily on all seven AI engines Cituna tracks, Grok and Google AI Mode included, on a self-serve plan, use Cituna. It asks your buyer prompts on ChatGPT, Perplexity, Gemini, Claude, Grok, Google AI Overviews and Google AI Mode every day, shows the share of your tracked category prompts that name you next to each tracked rival’s, with which engines name each brand, marks the answers that use your page as a source without naming you, and writes the fix for the prompts where a rival is named instead. Plans start at $49 a month for 10 prompts on all seven engines, after a 3-day free trial.
See the plans and start a free trial to get your share of AI answers next to each rival’s on all seven engines, measured every day.
Other tools report share of voice for other needs. Each fact below was read on the vendor’s own pages on the date shown, through our Semrush AI Visibility Toolkit pricing and Ahrefs Brand Radar pricing guides and our comparison of HubSpot’s grader. The table lists only the tools whose share-of-voice report we have read on the vendor’s own pages, which is why some tools AI engines name often, Profound and Otterly among them, are not in it.
| Tool | What it reports | Engines | How often | Entry price | Read on |
|---|---|---|---|---|---|
| Cituna | Share of your tracked category prompts that name you and each tracked rival, which engines name each brand, and answers that cite you without naming you | ChatGPT, Perplexity, Gemini, Claude, Grok, Google AI Overviews, Google AI Mode | Daily | $49 a month (10 prompts), 3-day trial, card required | October 23, 2026 |
| Semrush AI Visibility Toolkit | Brand Performance report: share of voice, sentiment and narratives | Mentions from ChatGPT, Google AI, Gemini and Perplexity; Claude and Grok not named | Prompts tracked daily; Brand Performance refreshed weekly | $99 a month per domain, billed annually (25 prompts) | October 9, 2026 |
| Ahrefs Brand Radar | AI share of voice, mentions, citations and search-weighted impressions from its prompt index | Index: Google AI Overviews, Google AI Mode, ChatGPT, Perplexity, Gemini, Microsoft Copilot; your own prompts add Claude; no Grok | Index re-tested monthly; your own prompts daily, weekly or monthly | Index $199 a month per platform or $699 for all six; own prompts from $50 a month for 2,500 checks | October 2 and 7, 2026 |
| Peec AI | Visibility, position, sentiment and share of voice against the competitors you name | Three models you pick on self-serve plans; Claude and Grok on Enterprise | Daily | $95 a month, or $80 billed annually (50 prompts) | October 1 and 5, 2026 |
| HubSpot AI Search Grader | A score out of 100 in which share of voice is one of five parts (10 points) | GPT-5.4 mini, Perplexity and Gemini, answering from training data | Once, when you run it | Free | October 10, 2026 |
Picks by need:
- Share of voice beside the Semrush SEO data you already use: the Semrush AI Visibility Toolkit, $99 a month per domain billed annually, with share of voice in its weekly Brand Performance report.
- Category-wide share of voice from a large prompt index, or Microsoft Copilot in the mix: Ahrefs Brand Radar, $199 a month for one platform’s index or $699 for all six, with your own prompts from $50 a month in checks.
- Sentiment next to share of voice, for a team that wants unlimited users: Peec AI, from $95 a month for 50 prompts on three models you pick.
- A free, one-time read before you track anything: HubSpot’s AI Search Grader.
Whichever you choose, check three things against the method above before you trust its number: whether its denominator is answers or mentions, whether it leaves out prompts that name your own brand, and whether it shows each engine on its own. For the plans and entry prices of 22 tools in the category, see AI visibility tool pricing.
A worked example: a ten-prompt scan
Imagine a hypothetical CRM, Tessera, with three main rivals: Northwind, Quorum and Bento. You build a ten-prompt set and run it through all seven engines, 10 prompts × 7 engines = 70 answers. (Ten prompts keeps the arithmetic readable; a real tracked set is usually larger, and the prompt pool on your plan is the only ceiling.) You read every answer and tally which brands it names and in what order. The numbers below are illustrative, not measured, and exist only to show the method.
Say Tessera is named in 21 of the 70 answers. That is a citation rate of 30% (21 ÷ 70), you are in the room roughly a third of the time. Encouraging on its own. But those 70 answers contain 210 brand mentions in total once you count every rival and the long tail of other tools, so Tessera’s 21 mentions are a simple share of voice of 10% (21 ÷ 210). Same brand, same scan, two very different-sounding numbers, because they answer different questions.
| Brand | Answers naming it (of 70) | Simple share of voice | Position-weighted |
|---|---|---|---|
| Tessera (you) | 21 | 10% | 7% |
| Northwind | 49 | 23% | 41% |
| Quorum | 35 | 17% | 19% |
| Bento | 21 | 10% | 10% |
Illustrative figures for a hypothetical scan, not real data. Simple share of voice divides each brand's mentions by the 210 total brand mentions across all 70 answers (the four brands shown hold 60%; a long tail of other tools makes up the rest). Position-weighted applies a simple weight to where each brand falls in the answer, roughly 1.0 for a first mention down to 0.2 for a late one, then re-shares the totals.
The position-weighted column is where the real story surfaces. Tessera and Bento have identical raw presence, both named in 21 answers, both at 10% simple share of voice. But Tessera is usually named last, while Bento lands mid-answer, so once you weight by position Tessera slips to 7% and Bento holds 10%. And Northwind, which looked like a 23% leader on raw mentions, is actually being named first most of the time, so its weighted share jumps to 41%. Raw counts said Northwind was ahead; position weighting shows it is dominating.
The same 70 answers also give the share-of-answers reading, the one that sets each brand against the same denominator: Tessera is named in 21 of 70 answers (30%), Northwind in 49 (70%), Quorum in 35 (50%) and Bento in 21 (30%). Because one answer can name several brands, these shares add up to more than 100%, which is expected: each is a separate “how often is this brand present” figure, not a slice of a pie.
Now split Tessera’s 21 answers by engine, as step 2 of the method says to. Every engine answered all ten prompts. Still illustrative:
| Engine | Answers returned | Answers naming Tessera | Tessera’s share of answers | Answers naming Northwind |
|---|---|---|---|---|
| ChatGPT | 10 | 6 | 60% | 9 |
| Perplexity | 10 | 5 | 50% | 8 |
| Google AI Overviews | 10 | 3 | 30% | 7 |
| Gemini | 10 | 3 | 30% | 7 |
| Claude | 10 | 2 | 20% | 6 |
| Grok | 10 | 1 | 10% | 6 |
| Google AI Mode | 10 | 1 | 10% | 6 |
| All seven | 70 | 21 | 30% | 49 |
Illustrative figures for a hypothetical brand, not measured data. The per-engine rows add up to the totals in the table above: 21 of 70 for Tessera and 49 of 70 for Northwind.
The blended 30% hides the useful finding: Tessera holds its own on ChatGPT and Perplexity and is close to absent on Grok and Google AI Mode, while Northwind is named on at least six of ten answers everywhere. The work for the next month is the five engines below ChatGPT and Perplexity, Grok and Google AI Mode first, and the per-engine view is the only one that shows it. Re-run the same set on the same engines before comparing, because AI answers change from run to run and a single pass is one sample.
The takeaway from the example:
Benchmarks, honestly
The most common question about any new metric is “what is a good score?” For AI share of voice, the honest answer is that there is no universal benchmark, and you should be wary of anyone who hands you one. A “good” number depends entirely on your category (a two-brand niche and a fifty-brand market are not comparable), on which engines you measure, and on the exact prompt set you chose. An “average AI share of voice is 14%” statistic, quoted without your category and your prompts behind it, is noise dressed as a benchmark.
Two comparisons are legitimate, and they are the only two you need. The first is your own competitive set: are you gaining on the specific rivals the engines actually name in your answers? The second is your own trend: is the number moving in the right direction as you ship fixes? Both are grounded in your reality rather than a borrowed average.
Our own scan data (cituna.com, July 17, 2026):
Measuring by hand is a fine way to see reality once, but running a fixed prompt set across seven engines day after day, recording every brand, every position, every run, is a job nobody keeps up manually. That is the work Cituna automates: it runs your prompt set every day, shows the share of your tracked category prompts that name you and each tracked rival, measured on the same answers with prompts that name your own brand left out, marks which of the seven engines cite each brand, flags the answers that use you only as a source, generates the fix for each gap, publishes articles for the prompts you are missing, and pairs the answer-side numbers with a native Google Search Console connection so you can tie the metric back to real clicks instead of trusting a floating score. Share of voice is one output of the broader practice of AI brand monitoring, which also watches claims, rivals and cited sources. For the wider field of tools that measure this, see our rundown of the best AI visibility tools.
Share of voice is only the scoreboard, though; the next question is how to move it. That is answer engine and generative engine optimization: make sure the AI crawlers can reach you, structure content answer-first so a clean passage is easy to lift, build your brand into a consistent entity, and earn mentions on the sources the engines already trust. Start with the AEO guide and the GEO guide, then re-measure to prove the lift. Measure, fix, prove, repeat, and watch the share of voice move.
Drafted with AI assistance from our own research and Search Console data, and reviewed by Rahul A before publishing. Rules and prices change; check the linked official source before you act.